
Electric vehicles – will the grid cope?
29 September 2021
A common concern surrounding the transition to EVs relates to the ability of power networks to cope with the electricity consumption required to charge the EV batteries. The argument usually goes along the following lines. Home charging uses around 5kW of power when replenishing car battery. This is more than the power used by a typical household, even during peak times. If EVs become widespread and more people starts charging their vehicles at home, will the grid be able to cope?
In this article, we explore this argument by evaluating the electricity demand resulting from EVs owned by households in between now and 2036.
This analysis relies on two modelling tools developed by VLC:
- A spatial EV uptake model, which projects the share of EVs in sales and stock based on technological and policy assumptions.
- The Zenith strategic transport model, which forecasts travel patterns based on demographics and network developments.
The combination of these two tools gives access to a detailed picture of charging needs in the future, with an unparalleled level of spatial detail.
How many EVs on the road?
Representing less than 1% of all vehicles on the road in NSW, EVs are currently nowhere near a threat to the electricity grid. Projections for the coming decade vary greatly depending on the underlying policy and technological assumptions.
The analysis in this paper relies on a reference uptake forecasts built by VLC using its EV uptake model[1]. In this scenario, 60% of vehicle sales are BEVs in 2036, which sits between the low and high scenarios of ARENA[2] and BITRE[3] (Figure 1).
Figure 1. Reference EV uptake scenario compared with other uptake projections
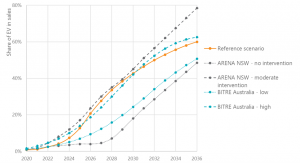
This translates into approximately 30% of vehicles on the road being EVs by 2036, with some moderate geographical variation: outer suburbs end up with higher uptake rates due to higher mileage driven.
How much energy to charge EVs?
We first look at the electricity required to charge EVs over time, assuming that all EV owners charge at home. VLC’s EV uptake model contains detailed information on EV energy efficiency by vehicle type, broken down by geography. We translate this vehicle information into EV energy usage for a typical weekday using the daily mileage in different locations from VLC’s transport model, Zenith.
We then aggregate EV energy consumption from EVs owned by households at the Local Government Area (LGA) level and compute the ratio between the energy required to recharge batteries at the end of a typical weekday with the average daily residential energy consumption[4] in 2019, reported by Ausgrid[5] and Endeavour[6]. In the rest of this article, we call this ratio the EV grid stress index. The smaller the EV grid stress index, the less risk of disruption to the grid posed by EV charging.
Figure 2 presents the distribution of the EV grid stress index for LGAs within Greater Sydney. With few exceptions, EV energy usage represents less than 20% of the 2019 residential energy consumption up to 2030.
These numbers are much less severe than what a crude calculation based on battery capacity would suggest: when refilling a full battery would typically use 40kWh of energy, a typical daily mileage of 30km only requires around 5kWh.
Figure 2. Distribution of EV grid stress index by LGA – Electricity consumption from BEV charging, as a percentage of 2019 residential electricity consumption
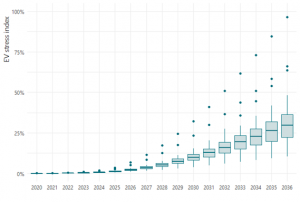
By 2036, most LGAs see ratios between 20% and 40% but a few LGAs go above 50%. These are areas with high car ownership rates, high population growth between 2020 and 2036 or long driving distances. In Greater Sydney, such areas are mostly found in the outer suburbs (left panel of Figure 3). In Camden, which is projected to see its population double between 2020 and 2036, the EV grid stress index is around 60% in 2036. In Wollondilly, it is the long driving distances which could create tensions on the grid.
Figure 3. Electricity required to charge EVs by LGA in 2036, as a share of 2019/20 residential electricity consumption. Left panel assumes all charging takes place at home; right panel assumes that all charging takes place at destination of first daily trip
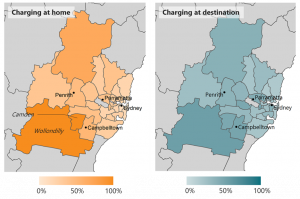
Note: No available electricity consumption data for Cumberland LGA
The case for smart charging
In the long term, BEVs could represent a significant strain on charging infrastructure in some areas. This will especially be the case if charging takes place during the evening, after people return home, when the grid is already under stress from people switching on their appliances after getting home but businesses have not switched off yet (Figure 4). This is the most likely case if people plug in their vehicles at home when back from work.
Smart charging, where EVs are programmed to charge at off-peak times, would shift some of the demand to periods of lower demand. If used at home, this would most likely be at night.
To tap into solar power, however, smart charging by itself will not be sufficient. EV owners would need to charge at their workplace or shopping centres.
Figure 4. Electricity demand profile for NSW – monthly weekday average
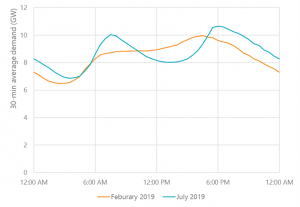
Source: AEMO Aggregated Price and Demand Data – Historical. Retrieved on 28 September 2021 from link
Can energy demand be switched to daytime?
People charging at work, the shops, or even train stations, could limit the burden on the grid in some areas. Charging at destination also unlocks more potential for efficient use of solar energy to charge EVs.
To assess the magnitude of this effect, we compute the energy required to charge EVs, assuming that all charging takes place at destinations: commuters would charge at work, shoppers would be able to charge at their place of shopping, etc. To calculate that, we combine the electricity efficiency from the EV uptake model with the travel pattern information from Zenith[7].
While this assumption is not realistic, it gives an upper bound of the transfer of energy demand which could be achieved by rolling out a network of out-of-home charge points.
Figure 3 (right panel) presents the result of this analysis. There is a small shift of demand away from the outer suburbs, with no LGA reaching 100% in EV grid stress index. However, the demand outstrips current roof solar production capacity. The energy to recharge EVs in 2036 on a typical day is 5 to 10 times higher than the current solar energy exported to the grid. With more solar production planned, the energy demand from EVs could stop being a problem: EVs soaking up excess solar production during the day would be feeding it back into the grid at night.
EVs as batteries on wheel
Small-scale projects have demonstrated that household batteries could provide valuable[8] grid stabilisation services, as part of Virtual Power Plants. With vehicle-to-grid technology now mature, EVs could play a key role to help the grid incorporate more variable renewable energy sources.
EVs could provide close to 100,000 MWh of battery capacity by 2036 in NSW alone. This compares to around 3,000 MWh of overall battery capacity in Australia, and 250 MWh of household small-scale in 2020[9] in Australia.
Private vehicles being parked on average 95% of the time, they could provide battery capacity most of the time. The issue, of course, is to understand where the EVs will be and when, and whether it is possible to rely on these moving batteries.
Acknowledgements
I would like to thank Daniel Veryard for his comments and review, as well as Simon Ho for preparing the Zenith data used in this paper.
[1] For more information, see Benezech, V., Ng, N. and Basile, A (forthcoming) Measuring the distributive impacts of electric vehicle policies, Australasian Transport Research Forum 2021 Proceedings
[2] Energeia (2018) Australian electric vehicle market study, report prepared for the Australian Renewable Energy Agency, p. 81, viewed 5 July 2021, link
[3] BITRE (2019), Research report 151, Electric vehicle uptake: Modelling a global phenomenon, viewed 5 July 2021, link
[4] Comparing electricity demand from EVs to residential consumption is only meant to put these numbers into perspective. Residential electricity consumption represents half of total electricity consumption on average.
[5] Ausgrid (2020) Ausgrid 2019-2020 Local Council Community Electricity Report, accessed on 27/09/2021 at link
[6] Endeavour Energy data form 2014, upscaled to 2019 using LGA-level population data from NSW Department of Planning Industry and Environment.
[7] Car-driver matrix from a 2036 reference case. The analysis assumes that BEVs and ICEs follow the same travel patterns.
[8] AEMO (2021) AEMO NEM Virtual Power Plant Demonstrations, accessed on 30 September 2021 link
[9] Clean Energy Council (2021) Clean Energy Australia Report, accessed on 30 September 2021, link