How do you balance road safety, walkability and congestion?
14 May 2024
Written by
Road deaths are up in NSW this year and 15% of those have been pedestrians. So, do we need to take a more holistic approach to road safety, and what happens when we do?
Last week was National Road Safety Week (May 5-12) in Australia, which is an initiative that seeks to highlight the impacts of road trauma and the ways we can help reduce it. In NSW, there’s been a 9% year-on-year increase in pedestrian deaths so far in 2024. With Sydney’s population increasing and areas densifying rapidly, pedestrian safety is a key challenge that’s growing in importance.
At the same time, policymakers, modellers and planners seek to encourage active transport and placemaking within Australia’s major cities. In this article we demonstrate the potential for relatively minor changes, an improved balance could be achieved between the needs of drivers behind the wheel and the safety and connectivity for those who walk and cycle.
Green Square: a classic example
Originally an industrial area that’s quickly becoming one of the most densely populated parts of Sydney, Green Square is a prime example of an area that could benefit from a more ‘people-first’ approach.
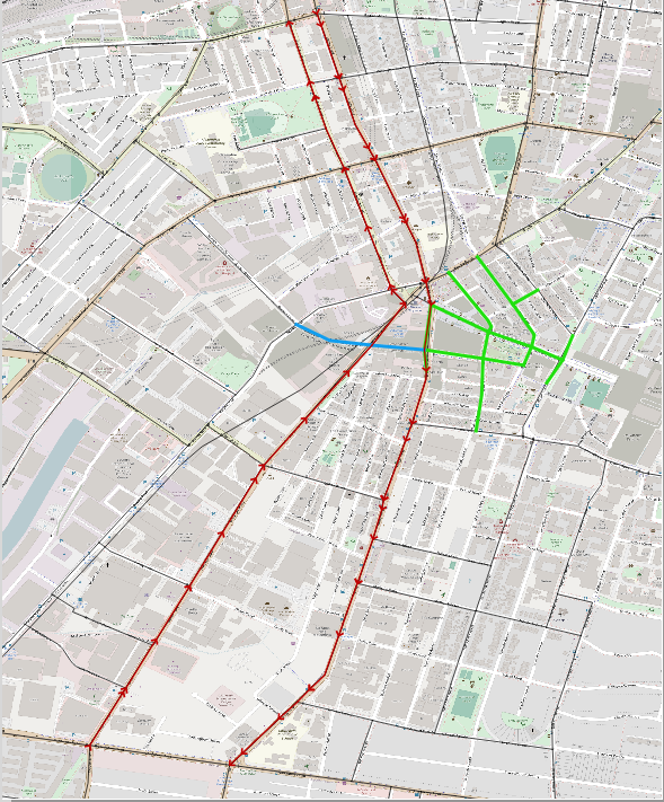
The current road network features arterial roads that provide connectivity through the inner south of Sydney (Bourke Rd, Botany Rd, Wyndham St, O’Riordan St) but unfortunately converge right at the emerging urban hub around the rail station.
Under this layout, pedestrians face long stretches of roads without safe crossings (and even with fence barriers) and long wait times at intersections. This gives rise to frustration and higher risk crossing behaviour, such as crossing on red signals or away from formal crossing.
A more balanced and walkable place (and an actual green square!)
With this context, we decided to test what would happen if we revised and simplified the road network via an extended one-way system and reduced vehicle road space, including new bus lanes. Specifically, we tested extending the existing one-way operation of Botany Road and Wyndam Street south through Green Square, and (by directly linking Wyndam and O’Riordan Streets) all the way to Gardeners Road (more details on the model and scenarios are in the technical note at the end).
The aim of this test is to see if these changes could enable an overhaul of signal timings and intersection configuration to significantly improve walkability and add public green space without undue loss of function for car and commercial vehicle drivers.
The image below highlights that new and faster pedestrian crossings are enabled and people would face waiting times significantly below a minute to make any movements in the new setup. This would strongly deter crossing on red as people would understand through experience that they would have a ‘fair’ opportunity to cross quickly and directly.
The alternative design also results in the expansion in size, usefulness and accessibility of a park at Green Square itself.
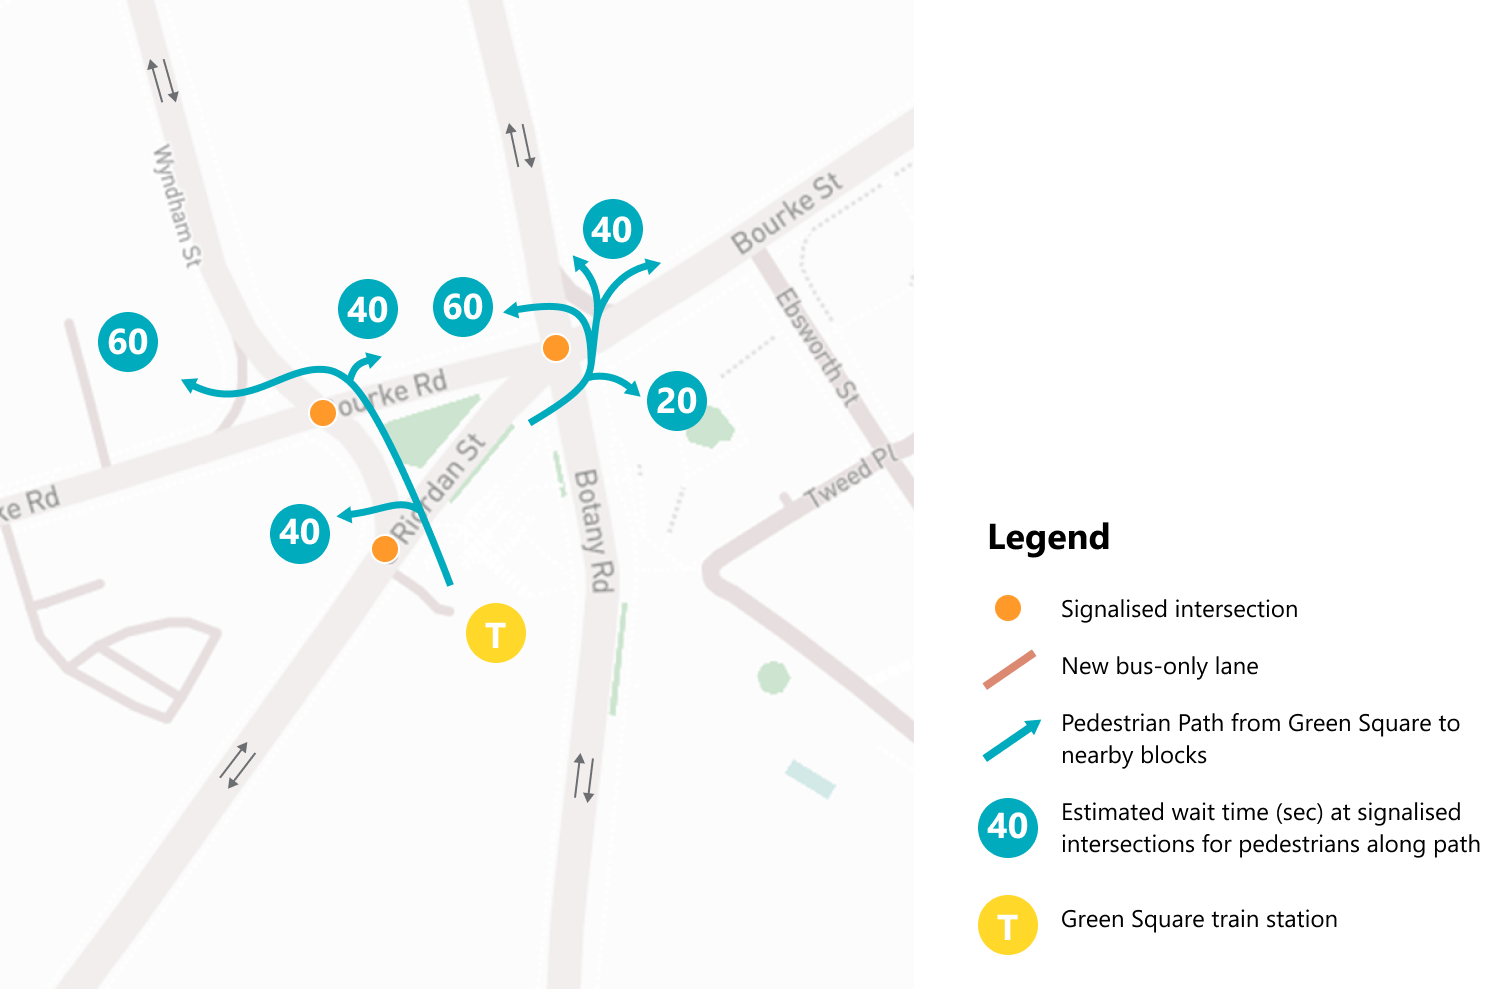
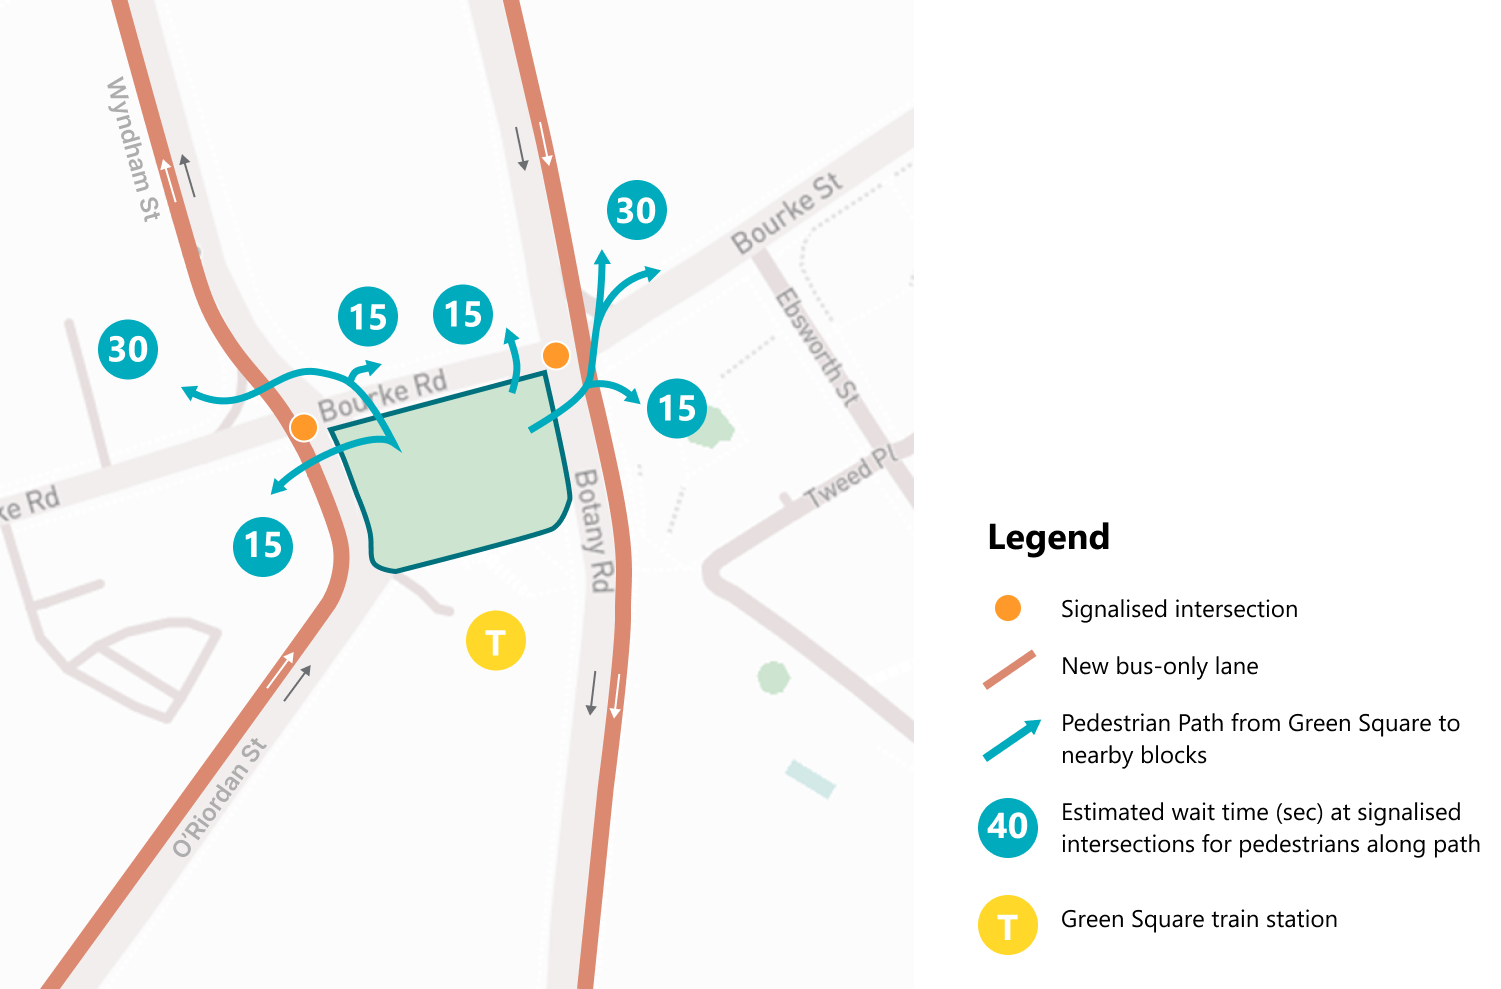
Slider 1: A comparison of the current layout of Green Square (slide 1 of 2) and our proposed hypothetical changes (slide 2 of 2).
Modelled findings
Running our hypothetical case through our multi-modal Zenith model yielded estimates of the potential road and public transport impacts around Green Square.
- The reduction in throughput capacity on O’Riordan St and Botany Rd leads to lower speeds and a reduction in traffic on these roads and a redistribution to other north-south running routes. As an example, severe congestion on Rothschild Ave at Epsom Rd (Level of Service, LOS F), indicates extra “rat-running” through local streets.
- Overall, traffic in the corridor would reduce by around 10%. So, whilst traffic increases for other north-south routes, the system continues to enable traffic flow at reasonable speeds.
- Public transport patronage is expected increase as bus speeds benefit from having priority, and the car alternative deteriorates. The city-bound bus service along O’Riordan St in the hypothetical case gains around 160 (22%) additional patrons per hour in the AM peak with a similar increase away from the city in the PM peak. The T8 train line sees a modest increase in patronage with longer distance trips able to change mode.
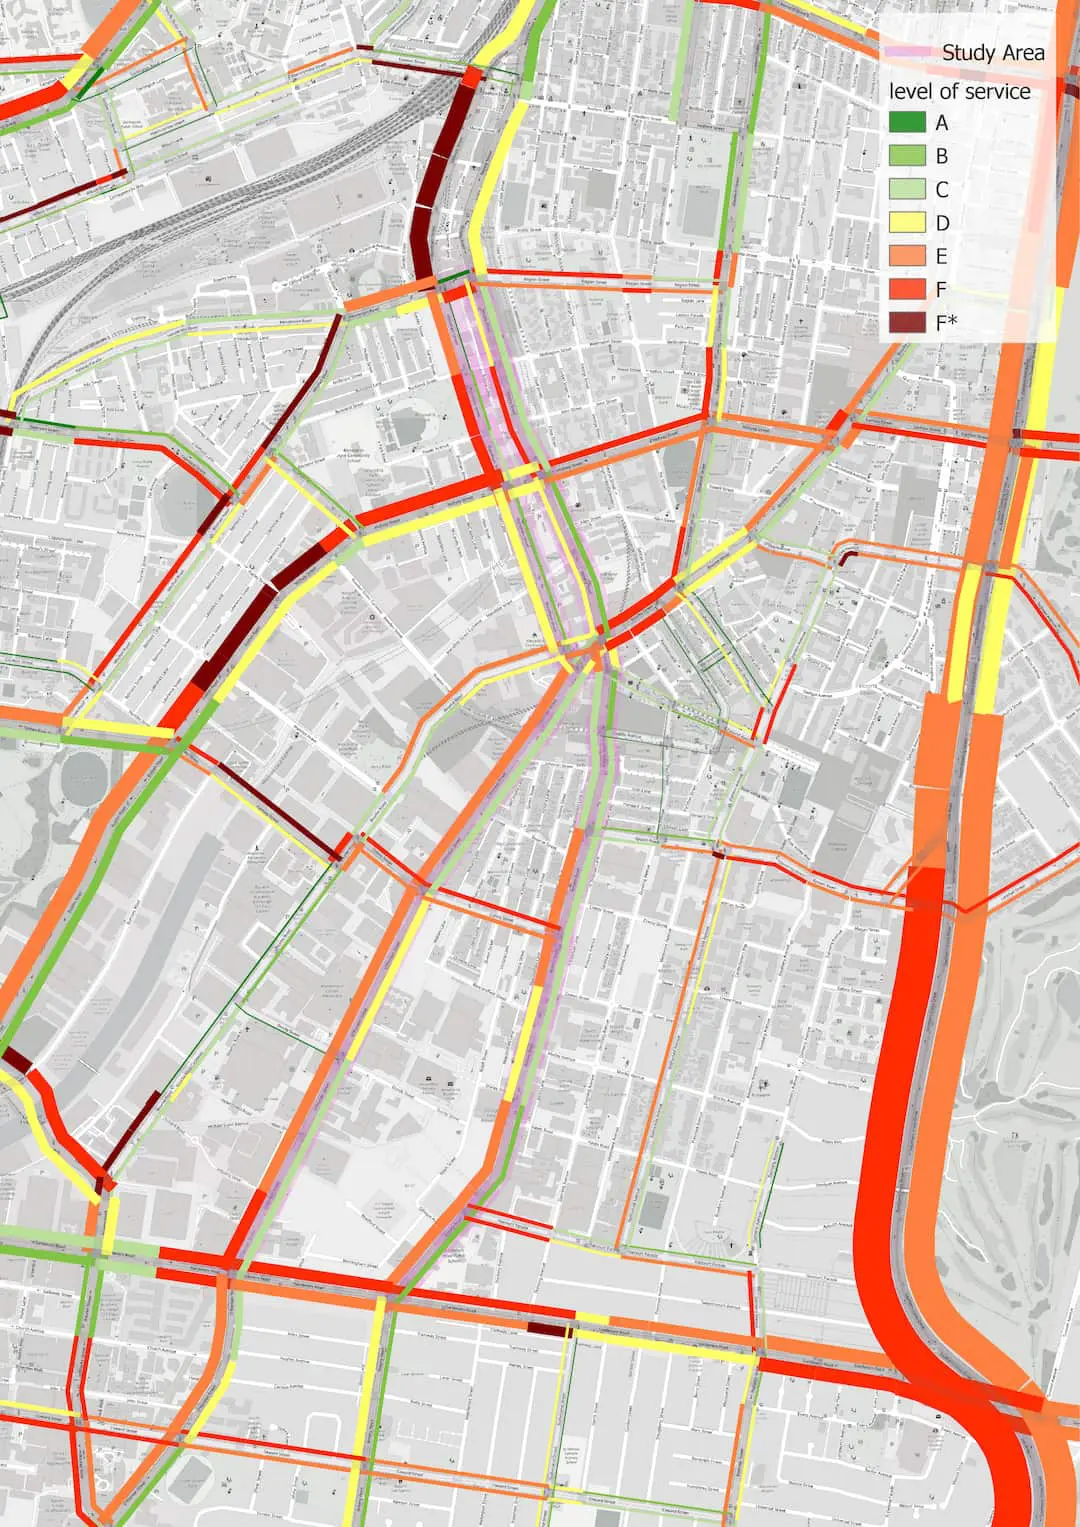
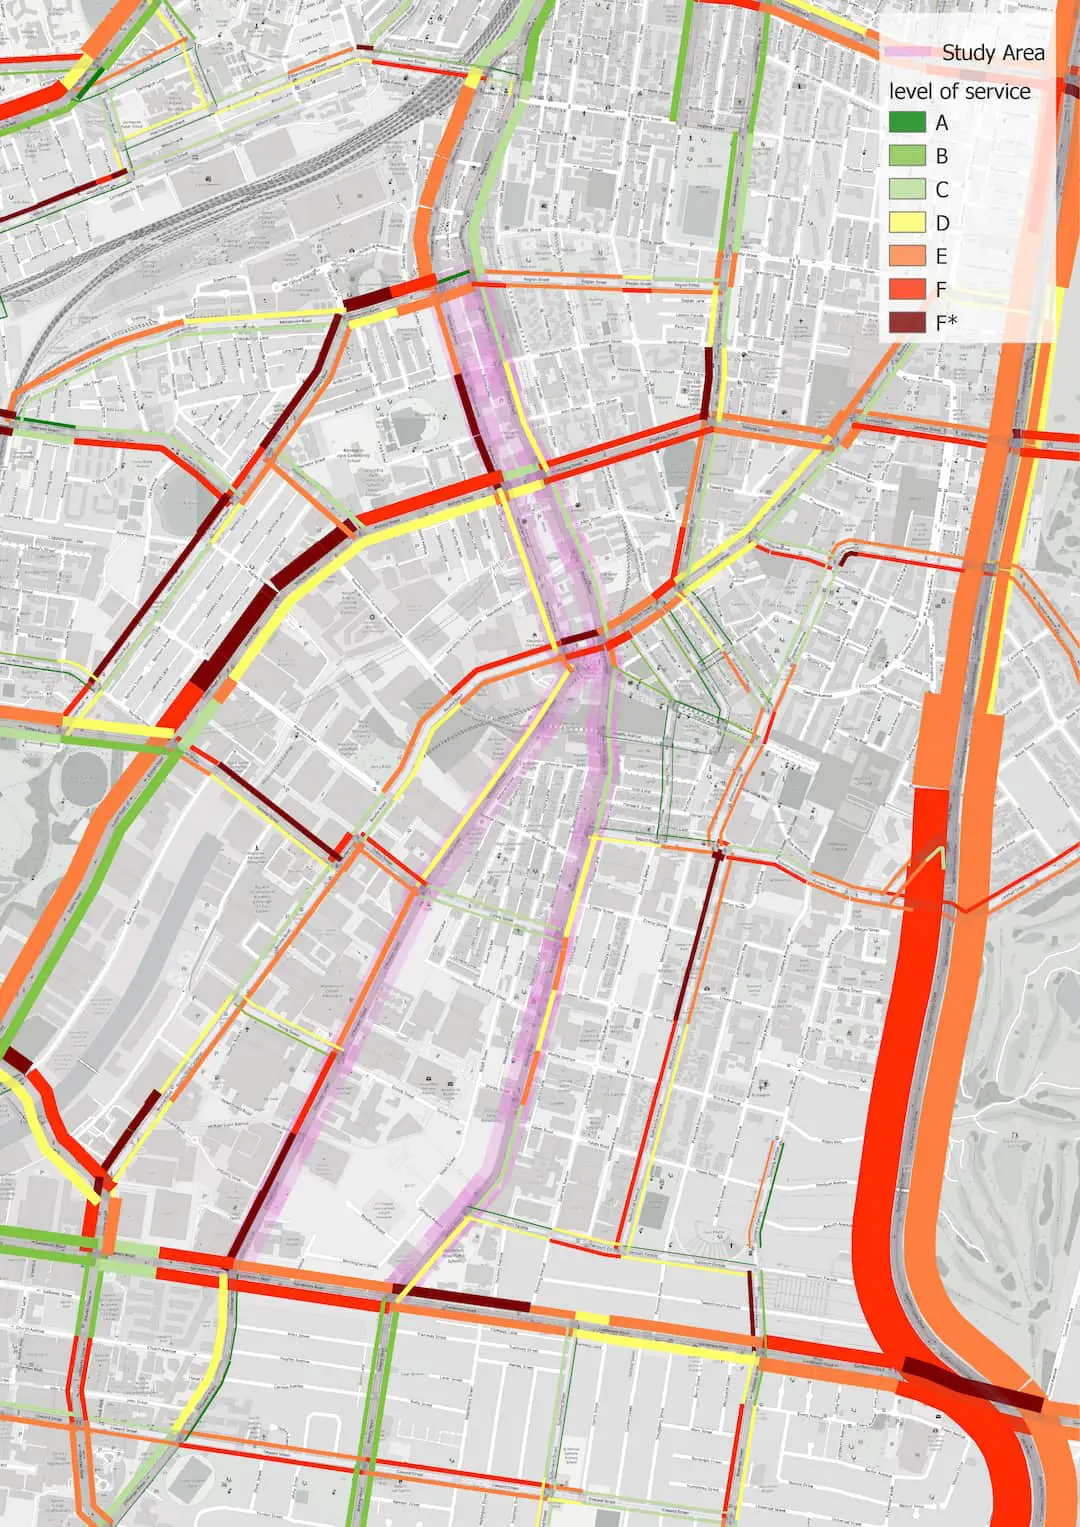
Slider 2: The estimated Level of Service during the AM peak period with (slide 1 of 2) and without (slide 2 of 2) the hypothetical network changes.
Further considerations
Given this was meant only as an illustration, further investigation would build stronger conclusions to those presented above, including:
- Re-specifying phasing of traffic signals and detailed intersection modelling to understand the impact of the revised layout with greater accuracy
- Modelling more forecast years (e.g. 2046 to see how full development at Green Square impacts the trade-offs)
- Make bus route and service frequency changes to take advantage of the proposed bus-only lanes along O’Riordan and Botany Rd
- Testing alternative road reconfigurations, such as contra flow bus-only lanes on O’Riordan/Botany to improve pedestrian interchange from Bus to Train or an Elizabeth/Bourke St to Botany or
- O’Riordan St tunnel to remove even more surface traffic to improve pedestrian accessibility.
A balanced approach to road safety
What we observed in our results suggested that streamlining the road network would reduce the overall volumes of traffic and redistribute some of the remaining traffic to other roads in the corridor, while improving pedestrian accessibility and public transport patronage. However, the negative effects on traffic elsewhere were not as significant as some might imagine, which shows that Green Square can handle some degree of traffic calming as a means of boosting pedestrian safety and the overall attractiveness of the place.
The kinds of challenges that Green Square faces can be found in countless guises across Australia, meaning the rationale behind this case could be used in other locations to generate active transport and placemaking benefits without unduly hampering the surrounding road network. As Australia’s cities continue to grow and densify, it isn’t a stretch to suggest that this walk-first approach will be a desirable trade-off to make.
Technical notes: Modelling a reimagined Green SquareWe tested a hypothetical case in the Sydney Zenith model for 2026 only. We have chosen this model as it has been estimated using the latest government land use and our assumptions for working from home. Further, the model incorporates the major network updates of WestConnex, Airport Gateway, and the City and South west Metro. On the supply side, the model includes various features, such as high-resolution travel zones (2,750 across the Greater Sydney area), and full representation of the public transport services (and major road network) across 4 time periods over a working weekday. On the demand side, trip purposes and household types are disaggregated with each having different behavioural equations explaining their number of trips, destination choice and mode choices. Travellers choose between different road and public transport routes according to a range of variables, including out-of-pocket costs and perceived factors applied to average performance measures including in-vehicle, walking and waiting times and the levels of crowding on public transport services (each computed by time of day). The model was run for a base case and a hypothetical case with the following changes to the road network:
These changes were implemented in our model as a way of creating better connectivity to/from public transport and the surrounding residential and commercial areas, with the aim of enhancing the livability of an area that’s highly accessible to other parts of Sydney.
Some limitations to our initial approach exist. This includes that: our test didn’t include any additional calibration/validation in the corridor that has occurred; no changes in centroid connectors have been made to reflect changes in pedestrian walk times; no major changes to bus services (five routes were realigned to work on the project case network, however service frequencies remained the same); zone size in the corridor means that specific pedestrian movements may not reflect real-world conditions. |
|---|