
How trustworthy is GPS mobility data for movement and place analysis?
27 August 2025
On face value, GPS mobility data has extensive and unique applications for movement and place analysis, but ensuring these insights are both accurate and meaningful is a complex (but worthwhile) process. Here’s how we do it.
What is GPS mobility data?
In a geospatial sense, GPS mobility data is a set of GPS signals that is collated from mobile device owners who have opted in to have travel data collected through numerous mobile apps, connected vehicles, fitness trackers and similar devices.

Each GPS signal contains a latitude and longitude, timestamp and an identifier linking the GPS signal to a device via a randomised identifier created by the data provider. The data that’s captured from consenting users is, in some cases, then aggregated, anonymised and packaged for purchase to use.
The benefits of mobility data for real-world decision making
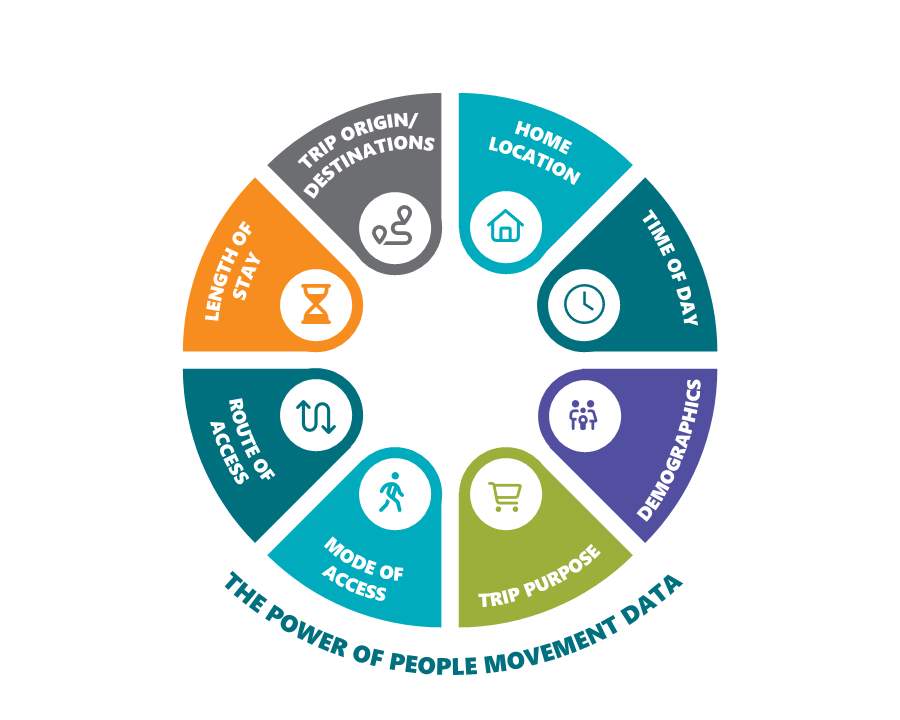
GPS mobility data has inherent characteristics that make it an appealing source of insights into movement and place (which might otherwise remain hidden) for a range of planning and commercial applications.
Some core advantages of GPS mobility data are:
- GPS has a high degree of spatial accuracy.
- It connects movements with the time they occur, allowing for analysis of how a given person behaves over multiple days.
- It’s possible to analyse movements across different modes of transport and routes.
- It shows movement activity outside of traditional transport networks.

These characteristics – in isolation and even more so in combination – present new avenues of analysis and to understand how people move in real and multi-dimensional ways.
To help us understand this potential (and the pitfalls that can arise), let’s take a deeper look at the process of how GPS mobility data is sourced, turned into meaningful information, tested and validated, and then expressed.
Step 1: Sourcing quality data
Mobility data is captured from a range of sources, which is to say that not all mobility data is the same.

Some categorical examples include:
- Telco data: This data – which is not strictly ‘GPS’ mobility data but can offer similar insights – is collected through mobile phone tower signals from telecommunications providers. It has a high sample size that’s consistent over time, but a lower level of geographical accuracy.
- Connected vehicle data: Vehicle data can provide narrow but deep real-time insights including sensor data to show acute events like sharp braking or ‘near misses’ for certain vehicle types.
- Mobile app-based GPS mobility data: Timestamped location data is aggregated and packaged from various apps tracking the location of consenting users, offering a high level of spatial accuracy but a lower sample size than Telco data.
VLC’s People Movement Data analytics is based upon the third of these sources: mobile app-based GPS mobility data. Its level of coverage, granularity and spatiotemporal nature make it a rich source of movement and place insights for a range of planning outcomes: traffic and transport, urban planning, tourism, commercial development and much more.
There are multiple data providers of GPS mobility data (and different ways of processing the raw data – see below), which means that the quality and relevance of data insights extracted from these datasets can vary markedly. For VLC and other providers of movement insights – whether that be through bespoke analysis or self-serve platforms like Planwisely – mobility datasets with adequate sample sizes to account for biases is imperative for ensuring quality data insights later.
Step 2: Turning raw data into meaningful information
The scale of GPS mobility data is incredible – with up to 60 billion data points captured within a single day, this kind of data requires advanced data science and computational power to evolve it from its raw form to something workable.

A single example – the process of turning GPS points into trips – shows the complexity facing teams working with this data. How long should someone be stopped to constitute the conclusion of a ‘trip’? How do you scale up your sample to correct biases by accurately weighting the importance of trips?
Because of the sheer scale of GPS mobility datasets, it’s only possible to investigate a sliver of the dataset at once. This means that effective data science pipelines and validation processes that can be used in a sample and then robustly applied to the full dataset are incredibly important but are also challenging to carry out correctly.
Step 3: Rigorous testing and validation
With the data now transformed from a vast morass of individual points into something usable, the next step is perhaps the most important: testing and validation that it is properly representative of people’s travel behaviours.

If proper testing reveals data discrepancies or gaps, then this could be cause for concern regarding the validity of the source data’s accuracy or coverage. Worse than this: without the right expertise and proper testing, the above concerns can go unnoticed – resulting in incomplete or misleading data insights downstream.
To test and validate the GPS mobility data that underpins our own People Movement Data, VLC has undertaken extensive ground truthing research. Our transformed data has been compared to:
- Household travel surveys (both metropolitan and regional)
- Pedestrian hourly profiles
- Traffic count profiles
- Shopping centre visitation profiles by day of the week
- National Visitor Survey research to understand tourist visitation
- Stadium attendance for major events
This research was able to demonstrate clear alignment between these datasets and our People Movement Data, validating its potential as a source of impactful movement and place insights.


Slider 1. Validating People Movement Data against Household Travel Survey data in Victoria (slide 1) and Queensland (slide 2) reveals that GPS mobility data can be used to analyse travel that would traditionally not be captured.
Step 4: Turning information into insights
Now, equipped with usable data that’s been thoroughly tested and validated, it’s finally possible to start expressing it in ways that enables meaningful movement analysis and subsequent insights.
GPS mobility data can be used to answer important questions such as:
- Where are people travelling to/from?
- Has visitation to a location changed over time and how does this vary through the day and week?
- Where do people travel through and where do they stop?
- How long do people stay in a particular location?
- What type of people use a place or link in the transport network?
VLC performs custom People Movement Data analysis to answer the above questions – here are just a few examples of custom People Movement Data analysis:
Activity centre analysis: Box Hill Metropolitan Activity Centre
Activity heatmaps can be created using People Movement Data to understand how people use areas at different times of the day, and days of the week. This enables planners to leverage the strengths of a centre and consider transformation of under-appreciated areas.
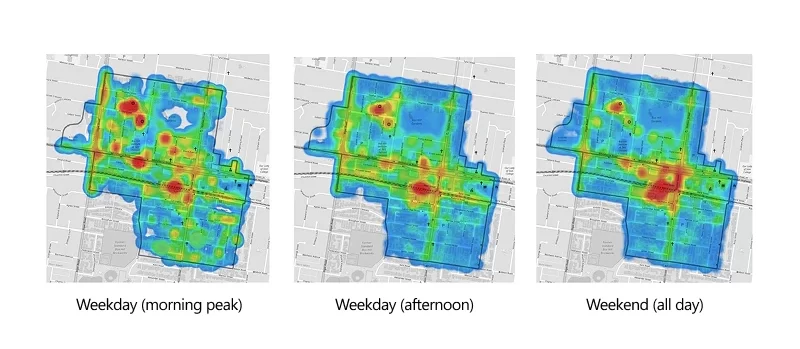
While uses in Box Hill in this analysis are mixed, morning (peak) activity is concentrated around the train station, an area including shops, office areas, gyms, and cafes. Afternoon activity is more widely spread, with weekends seeing heavier visitation in the broader retail precinct.
Measuring new infrastructure impacts: Adelaide Northern Connector
Understanding how travellers respond to new infrastructure, network changes or policy changes is critical to understanding the success of new initiatives. Being able to convey that success visually and intuitively is a powerful tool to demonstrate that impact to decision-makers.
Below, users of the Northern Connector after opening are identified and then trip patterns for those same users are analysed before opening to understand how their travel patterns changed.
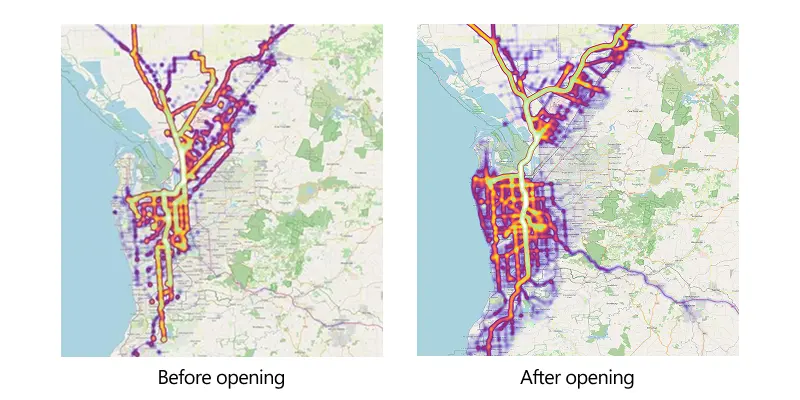
The Northern Connector is a six-lane, 15.5km motorway providing a major freight and commuter link between the Northern Expressway, South Road Superway and Port River Expressway.
The differences between before opening (left) and after opening (right) demonstrate what impact the Northern Connector has had (shown through heatmaps of relative activity in each scenario), including improved accessibility across Adelaide, especially the western and southern suburbs, and improved accessibility to the M1 towards Murray Bridge; one of South Australia’s major freight routes.
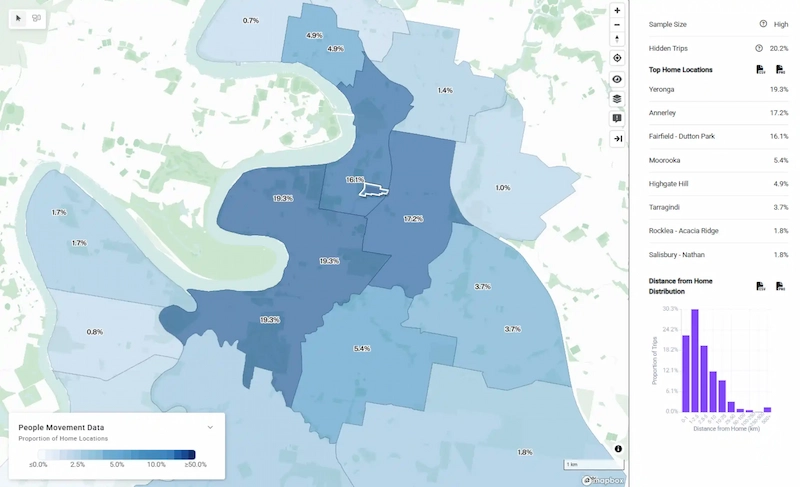
Self-service People Movement Data analysis: Planwisely
Meanwhile, Planwisely’s self-serve planning intelligence platform gives users the ability to autonomously analyse GPS mobility data through various lenses such as trip patterns, activity intensity time profiles and length of stay analysis in a map-based interface.
How to avoid misleading datasets and insights
Despite its potential, GPS mobility data is not immune to misinterpretation. Misleading insights often stem from poor data sourcing, inadequate sample sizes, or flawed processing methods.
‘Mobility data has a massive range of applications for movement and place analysis,’ says VLC Executive Director (Modelling & Analytics) Ali Inayathusein.
‘But those insights are meaningless, and can even be harmful, if they don’t come from quality data that’s been properly processed.’
To avoid these pitfalls, it’s essential to:
- Understand the limitations of the dataset: Not all GPS mobility data is created equal. Differences in sample size, geographic coverage, and data collection methods can significantly affect the reliability of insights.
- Validate against trusted benchmarks: Cross-referencing GPS-derived insights with established datasets – such as household travel surveys or traffic counts – helps confirm accuracy and representativeness.
- Apply rigorous data science practices: From trip segmentation to bias correction, every step in the data pipeline must be carefully designed and tested to ensure robustness.
- Avoid overgeneralisation: Movement patterns can vary widely across demographics, regions, and timeframes. Insights should be contextualised and not assumed to apply universally.
- Use transparent methodologies: Clearly documenting how data is processed and validated builds trust and allows others to assess the reliability of the findings.
By taking these precautions, GPS mobility data can be a powerful and trustworthy tool for movement and place analysis—one that supports informed decision-making across planning, policy, and commercial domains.