Rumours of bad data in transport models based on bad data
22 January 2016
Written by

On Thursday 14 January, theconversation.com published an article from Curtin University’s Peter Newman entitled Defying the ‘one-hour rule’ for city travel, traffic modelling drives policy madness . This article critiqued Traffic and congestion cost trends for Australian capital cities , a report from the Bureau of Infrastructure, Transport and Regional Economics (BITRE), which aimed to “identify long-term trends in urban traffic growth and estimate the consequent impacts of that traffic growth on road network congestion levels”.
Newman’s article suggests, fairly, that investment in public transport and well-designed land use patterns (rather than further urban sprawl and continued investment in road infrastructure) are needed for sustainable growth. However, Newman also asserts that Australian transport modelling is supporting ongoing road investment, and is “out of touch” and “dangerous”. His critique of BITRE’s report is used to support these assertions.
Newman’s discussion of the BITRE report, and the state of Australian transport modelling generally, is misleading, illogical, and in one case presents falsely exaggerated data. It is deserving of thorough review and rebuttal.
Did BITRE’s modelling rely on ‘heroic’ growth assumptions?
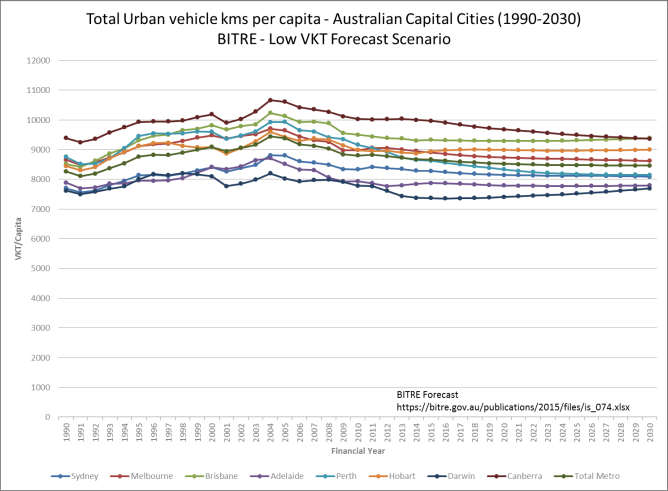
Newman suggested that modelling “relies on heroic growth assumptions” of vehicle kilometres travelled (VKT) per capita. He supported this by presenting the following chart:
Source: Peter Newman, via www.theconversation.com
Figure 1 is not from BITRE’s report. It has been independently created from the data BITRE released in conjunction with the report, and is not an accurate representation of BITRE’s High VKT scenario as titled. This chart can only be produced from BITRE’s data by calculating VKT per capita using VKT from the High VKT scenario, and population from the Low VKT scenario. These population assumptions are far lower than those in the High VKT scenario, and result in much higher VKT per capita values. The growth rates that Newman attacked in his article were never assumed by BITRE.
The chart is also misleading because it has a non-zero y-axis base, making the assumed growth appear to be extreme.
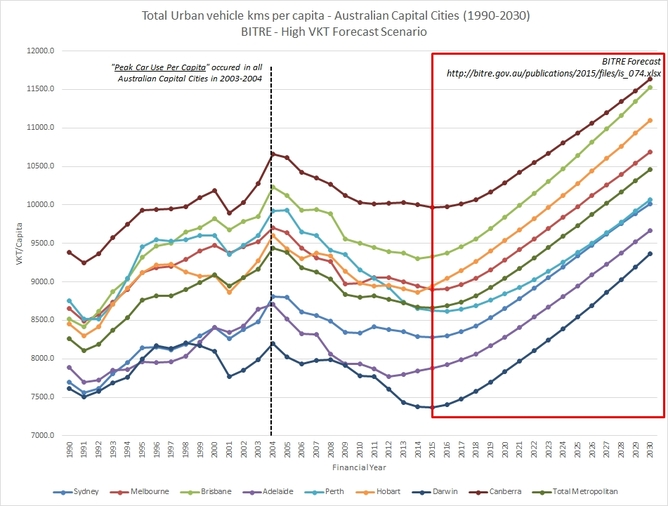
Recreating the chart using the actual VKT and population values of the High VKT scenario and a zero y-axis base creates the following more representative and less sensational image. It shows VKT per capita recovering to 2004 levels by 2022, and increasing slightly through to 2030.
Source: https://bitre.gov.au/publications/2015/files/is_074.xlsx
In BITRE’s High VKT scenario, the ‘Total Metro’ compound annual growth rate (CAGR) from 2015 (the last year based on observed data) to 2030 is 0.89%, while from 1990 to 2004 it was 0.95%. So the ‘heroic growth assumption’ is in fact lower than previous observed data.
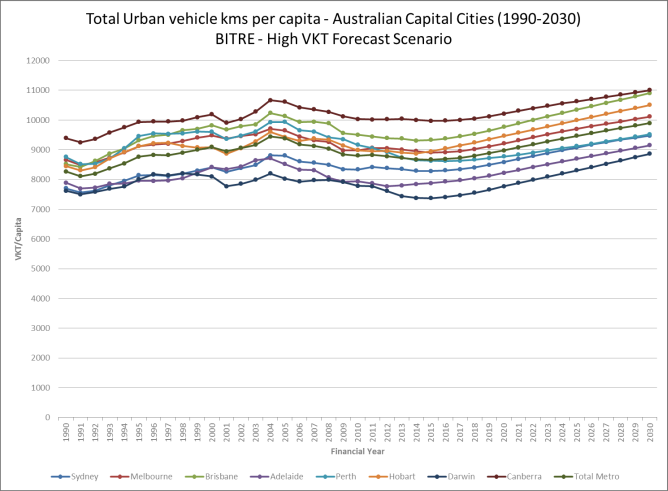
Finally, the BITRE report doesn’t suggest that the High VKT scenario is likely. In fact, the report states that it is less likely than the Low VKT scenario. The VKT per capita growth for the Low VKT scenario is shown below:
Source: https://bitre.gov.au/publications/2015/files/is_074.xlsx
According to this chart, BITRE’s Low VKT scenario predicts a stable VKT per capita, at levels approximately 5% lower than the peak which occurred in 2004. This prediction does not appear to be outlandish; to the contrary, VKT per capita has been approximately stable since 2009, meaning BITRE’s scenarios appear reasonable in the context of current trends.
What caused ‘peak car’ in 2004?
Newman states that “It is possible to understand the global peak car phenomenon in terms of cities hitting the Marchetti wall”. This is the same peak car phenomenon which he identifies as occurring in all of the world’s developed cities in 2004.
This explanation implies that all of the world’s developed cities reached the point in development where they cannot continue to expand outward in 2004. It implies that Darwin (2015 population of about 150,000) hit the ‘Marchetti Wall’ at the same time as Sydney (2015 population of about 5 million). It is clearly an unreasonable explanation.
The 2004 peak, which was observed globally in cities as diverse as Darwin and Sydney, cannot be due to Marchetti’s Wall. This does not in any way discredit Marchetti or his Wall – which may be a real phenomenon – but the 2004 peak must have been caused by something else.
BITRE’s report explored the cause of the 2004 peak in VKT per capita, contrary to Newman’s claims, and attributed the reduction to increasing fuel prices, economic slowdown after the GFC, and a reduction in driver’s licence holding rates among young people. These factors, which have a global impact, offer a more likely explanation of the global peak car phenomenon than Marchetti’s Wall or changes to urban growth patterns, which vary between cities and take a long time to take effect.
Assuming BITRE is correct, do these factors point to a continuing downward trend in VKT per capita?
Fuel prices fluctuate (and are today at 10 year lows), and economic cycles come and go. The factor that could cause a continuing decline in VKT per capita is a reduction in licence holding rates and vehicle ownership. Young people in NSW became less likely to hold an independent (open or probationary) driver’s licence during the 2000s. Figure 4 shows that licence-holding declined between 2005 and 2010, but then stabilised, and remained stable through to 2014 (this is remarkably consistent with the trends in VKT per capita identified by BITRE).
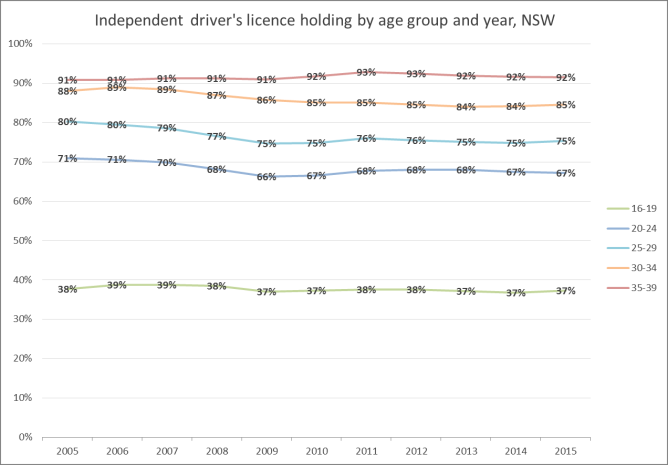
Sources: www.rms.nsw.gov.au, www.abs.gov.au
Inclusion of learner licences (Figure 5) makes the picture less clear. In NSW, 78.5% of people aged 20-24 held a learner or independent driver’s licence in 2005. By 2009, that number had decreased to 75.1%, but then climbed to a new peak of 79.2% in 2012. This data suggests that most young people may still be intending to hold a driver’s licence, but changes to qualification processes may have made this more difficult.
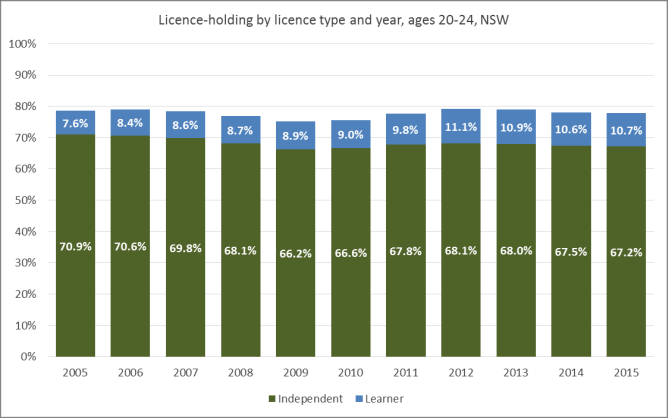
Sources: www.rms.nsw.gov.au, www.abs.gov.au
The decline in VKT per capita from 2004 could be the start of a long-term trend – but the data doesn’t confirm this. Rather, it suggests the decline may have been an ‘adjustment’ caused by an increase in fuel prices coinciding with a step change reduction in licence holding rates among young people. Furthermore, the stabilisation of VKT per capita post 2009 suggests we may have reached a new equilibrium.
Could VKT per capita increase further?
BITRE’s High VKT scenario is representative of a future where Australia is not at VKT per capita saturation yet (i.e. a future in which VKT per capita can still continue to grow). Is this a plausible scenario?
VKT per capita is influenced by land use patterns and transport infrastructure, but additionally by broader societal trends, such as the gradual aging of our population, and trends in licence holding and vehicle ownership.
While independent licence-holding among young people may have declined (and then stabilised) in the last decade, Figure 6 shows that a much broader age range of older people is experiencing increasing licence-holding rates:
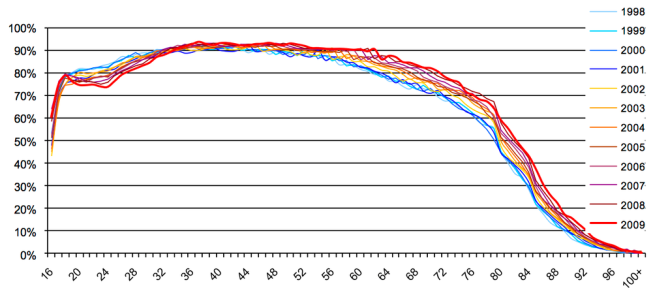
Source: Raimond and Milthorpe, 2010, Why Are Young People Driving Less? Trends In Licence-Holding And Travel Behaviour.
There is significant room for licence-holding rates (and mobility) to continue to grow in higher age groups over the coming years. The Victorian Department of Transport report, Maintaining Mobility: The Transition from Driver to Non-Driver (Victorian Department of Transport, 2007), forecast that licence-holding rates among people aged 60+ would increase from 73% in 2001 to 96% in 2031.
Additionally, advancements in medical technology are likely to prolong life and improve quality of life, potentially resulting in a longer proportion of lifespan where driving is possible (and therefore a higher proportion of the population able to drive).
And then there’s the possibility that autonomous vehicles will happen and change everything. If that does happen, it’s hard to see car use declining.
Collectively, these factors suggest that VKT per capita could increase further. This is not the same as saying that it will – it simply means that the High VKT scenario tested by BITRE is plausible.
Is BITRE’s report supporting ongoing investment in road infrastructure?
BITRE’s report is designed under the assumption that the majority of travel will continue to be made using private motor vehicles:
“… even though [urban public transport] always accounts for an important component of aggregate city pkm (and urban rail typically a major share of radial movements into the Central Business Districts of the larger cities), the bulk of urban passenger travel will still be performed on the road system, largely by private motor vehicles”
This assumption is made because it is consistent with State and Federal strategic planning documents and infrastructure programs. Future plans for Australian cities overwhelmingly include major residential fringe development, continued densification of employment in city centres, and transport infrastructure programs focused primarily on road projects, with public transport primarily serving the CBD. BITRE’s work didn’t recommend those plans, it tested them. And the results aren’t exactly a glowing recommendation.
BITRE’s report estimates the avoidable cost of congestion will be “around A$30 billion by 2030” – up from $16.5 billion in 2015. This is a big number, but much lower than the A$50 billion which Newman quoted. The $A50 billion figure is the highest possible cost, only seen under an assumption of “holding the network infrastructure of each city roughly at current levels” – an unrealistic ‘do nothing’ scenario.
Still, A$30 billion is roughly a doubling of the avoidable cost of congestion in 15 years. Per person, it’s an increase from about $1,000 in 2015 to around $1,500 in 2030. That doesn’t support continuing with business as usual.
In all, BITRE’s report doesn’t support one path of development or another. It simply estimates what the future will look like if a set of assumptions should be realised. The findings of this report suggest that continuing with current policies of dispersed land use and road network investment will not improve traffic congestion. Newman could have used the valid results of this study to support his own assertion that we should “build public transport and land-use options that can enable economic growth to occur sustainably”.
Advocating for a more sustainable future for our cities is an admirable cause, which is not furthered by misrepresentations of modelling reports and the transport modelling industry generally.