Measuring and incorporating a wider set of bus priority benefits in strategic modelling
16 January 2025
Written by
Ever feel like you’re missing something?
In transport modelling, we can generally get reasonable answers and insights from our tools. But sometimes we get the feeling that something important is not being captured.
In the past year, my team modelled two different bus priority projects by speeding up the buses no longer stuck in mixed traffic. In both cases we found only a modest number of travellers would divert from car onto buses. And, unsurprisingly, the economic analysis showed that it wasn’t worth taking over traffic lanes to install dedicated bus lanes.
However, we know that bus lanes and busways are associated with improvements in things that travellers value beyond just average speed: reliability and route legibility. We also know that, in practice, many of the most heavily used bus routes are those that have priority over other traffic.
A conversation with a colleague who specialises in customer research sparked some ideas on how to resolve this disconnect. Then, after exploring alternative technical approaches with VLC colleagues, we settled on an innovative and practical way to reflect customer valuations of bus priority within a standard transport model.
The rest of this article summarises a paper (available on request) I delivered at the Australasian Transport Research Forum in Melbourne in November on behalf of VLC co-authors Nancye Ng, Stuart Donovan, Zachary Gray, Haoang Li, Cameron Reid and Azim Bhutta.
Step 1: Understanding customer valuations of bus priority
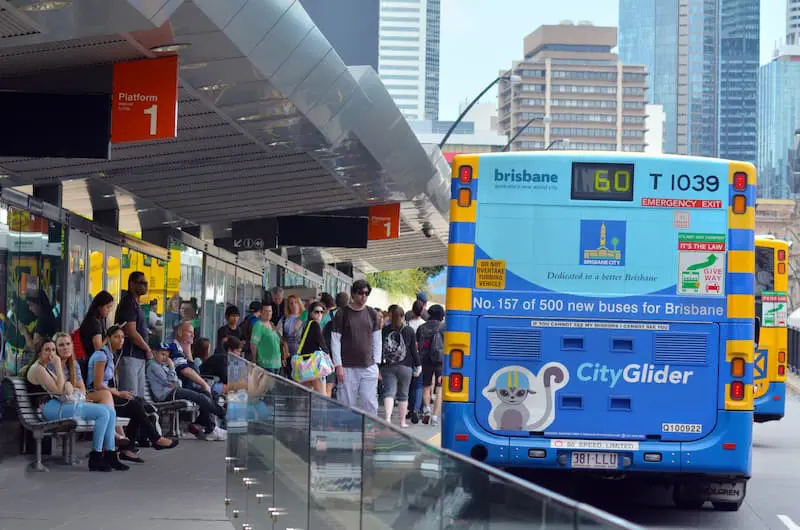
Our first strategic choice is to explore route-level patronage data (see graph above) to identify the ridership payoff from bus priority specifically, by robustly separating the effects of speed from other elements.
Statistical analysis identifies that for each percentage-point increase in bus priority coverage on ridership was 1.1% higher (this finding controls for the population catchment on the route, as well as basic bus service quality aspects, i.e. frequency and speed).
This is a huge effect that validates the earlier intuition that we were missing something important.
For example, if bus priority was introduced along 50% of a previously fully mixed traffic route, average speed might increase by 30% in peak periods. The faster buses could be expected to gain some extra patronage (using the same statistics, the gain is estimated at around 20% daily). More importantly, the bus route becomes more appealing to travellers due to non-speed factors such as reliability and legibility. Our statistical findings suggest that patronage would increase by a further 55% (=50*1.1), which is more than double the effect of the speed alone.
Part 2: Expanding pathways for bus priority to impact demand in a multi-modal model
Unlike in our statistical analysis, average speed is generally the only lever that is adjusted in a multi-modal model to represent bus priority projects.
We improve upon this typical treatment by incorporating the statistical findings (step 1) into the model. We do this by adjusting bus travel costs perceived by travellers considering these services. Perceived costs are adjusted in line with the extra bus priority on each route.
Routes that make most use of new bus priority (i.e. a higher % of their journey is on the new priority lanes) have their perceived costs scaled down more. The cost scaling is set to align the average demand response to the statistical parameter.
Case study: Extending bus priority in Brisbane
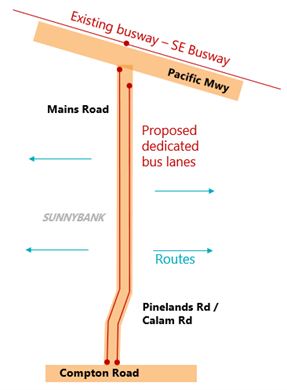
To illustrate the approach, we analyse the impact of a hypothetical bus priority project on Mains Road in Sunnybank, southern Brisbane, using VLC’s Zenith model.
The Base Case model reflects road and public transport services as of 2016. The study area focuses on a 6km north-south corridor comprising 3 lanes of mixed traffic, 18 bus routes, of which 8 routes continue onto the existing South East Busway along the Pacific Motorway to the Brisbane CBD.
In the Project Case, one mixed-traffic lane in each direction on Mains Road/Pinelands Road /Calam Road between the Pacific Motorway and Compton Road is converted into dedicated bus lanes. In this project scenario, all 18 bus routes that currently travel on this section of Mains Road are rerouted to use the dedicated bus lane. There is no increase in bus network service kilometres or frequency compared to the Base Case.
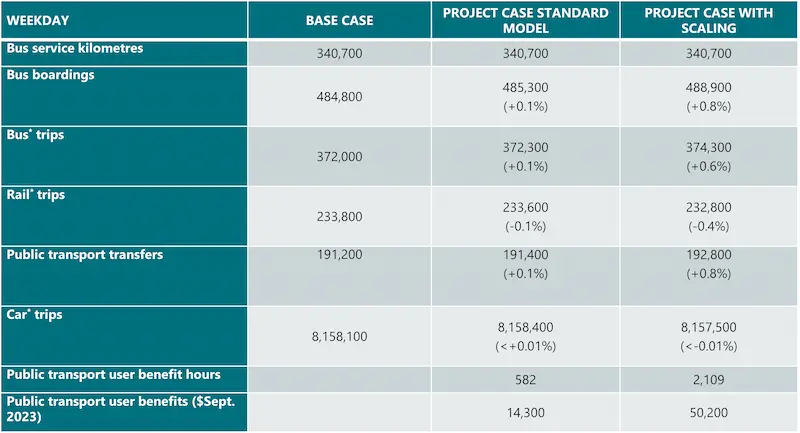
The Project Case standard model results in an increase of only 0.1% (+500 daily) in bus patronage model wide. However, when bus priority perceptions scaling is applied to the Project Case, there is an 0.8% increase (+4,100) in bus patronage. This substantially increases estimates of public transport user benefits (nearly four-fold).
On bus routes that benefit most from the bus priority project, a 47% increase in bus patronage is forecast when this scaling is applied, compared to without scaling. This extra bus demand is drawn largely from rail and other bus routes, rather than mode shift from car.
*‘Main mode’ trips, including those where another mode (e.g. car or bus) is used as part of the journey
With the cost scaling applied, public transport transfers increase by 0.8% model-wide, with up to 30% increases in volumes on project corridor buses. This is because people switch from other modes such as the Beenleigh rail line onto the project corridor buses, to take advantage of the improved bus service quality on the Project Case routes, which continue onto the South East Busway towards the CBD. These complex multi-modal effects demonstrate the value of undertaking this analysis in the full model rather than simply applying the statistical parameter bluntly.
Conclusions
In current transport demand models and economic appraisals, the value that customers place on bus service quality attributes provided by bus priority is not distinguished from standard buses, and hence its impacts are undervalued in infrastructure investment decisions.
Our research provides a proof-of-concept of how non-speed factors of bus priority can be represented in demand models, reflecting the nuance of each affected bus route, compared to standard bus services. We find significant increases in bus boardings and user benefits, that are currently not captured. Including these impacts has the potential to materially change infrastructure investment decisions.
