COVID-19 mobility impacts: A quick look at the data
1 May 2020

As we get our heads around the impact of COVID-19, policy and decision makers are seeking data in order to chart a pathway forward. VLC has published an interactive web-based COVID-19 mobility trend dashboard. It includes visits to CBDs, airports, rail stations and shopping centres for Melbourne, Sydney and Brisbane. This data is detected through analysis of mobile phone app-based data and will be updated periodically to provide a view of how trends are progressing over time.
What are the key trends?
As people have followed government guidelines and avoided discretionary travel, the expected reduction in travel activity is evident across the board, but there are interesting findings in the detail. A few key trends stand out:
- Sydney, Melbourne and Brisbane all saw significant declines (20% – 40%) in travel from 16th March when government guidelines advised against gatherings of more than 500 people. Strict social distancing guidelines introduced the following week led to further decreases with levels of movement falling to between 5% and 30% of usual levels when looking across CBDs, airports and rail according to this data.
- Rail usage has fallen more sharply than travel to the CBD or shopping centres and appears to have fallen by a similar magnitude to air travel.
- Although visits to shopping centres and suburban shopping centres in particular have dropped less than other categories, levels are still down to around 40% of pre-coronavirus levels.
Striking similarities across Australian cities
One may have expected that the response of citizens would vary substantially across the major cities. However, whether it’s a tram-riding Melburnian, a ferry catching Sydneysider or a bus commuting Brisbanite, it seems we may not be so different after all. Despite seeing Brisbane mobility levels decline a little more quickly than the other cities, the overall profile of changes across all categories, even in the period before mandatory social distancing directives were introduced in the week beginning 23rd March, have been very similar.
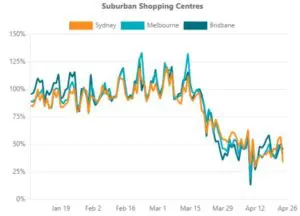
As an example, shown here are mobility trends associated with suburban shopping centres (taken from the COVID-19 mobility trends dashboard). We can see here just how closely the patterns evolve across the cities. Whilst this is not entirely surprising, it does matter and warrants further investigation and thought. It provides evidence that underlying behaviour may be more similar across regions than that is often assumed.
Wider implications for data collection and analysis
The degree of similarity in behaviour is important for all of us that seek to understand and model the travel behaviour of populations. By making it easier to compare travel behaviour across cities, these types of datasets could be used to understand the transferability of behaviour (and therefore models) from one area to another better.
Having access to data like this should allow us to understand better areas which have long suffered from a lack of data. For example, how do travel patterns change with the introduction of new infrastructure? How do they vary across different days of the week and times of year in different regions? These are basic (and often researched) questions which could really benefit from analysis of datasets such as these. Of course, the data here also has limitations including for example a lack of demographic information. This means that the answer to these questions lies in intelligently combining insight from different datasets, acknowledging the strengths and weaknesses in each.
Moving forward
We will continue to update our COVID-19 mobility trends dashboard weekly to monitor developments as we progress through the recovery phase. It will be interesting to see how travel and especially public transport patronage trends will evolve through this period and respond to changes in government policy as they come. Our hope is that different stakeholders within the transport industry find it to be useful.
I would like to acknowledge the significant contribution that my colleagues Benjamin Cowley and Dominic Endrei have made in release of the VLC COVID-19 mobility trends dashboard.