COVID-19 mobility impacts: Perth’s response
21 June 2021
Written by

After the initial COVID-19 wave of cases and lockdowns spread across the country in March 2020, Western Australia quickly bounced back. Local restrictions were progressively removed and urban travel rebounded quickly – particularly on the road network. Living in Perth for the first half of 2020, I was struck how ‘normal’ life was by June 2020. In 2021, however, Perth experienced several small outbreaks of cases and the periodic return of short-term local travel restrictions.
VLC’s team has crunched the numbers using a new dataset to understand how mobility has evolved through these ups and downs.
Measuring mobility using mobile phone data
Since the early days of the COVID-19 pandemic, VLC has been systematically tracking mobility outcomes across Australia’s three largest cities in our web-based COVID-19 mobility trend dashboard.
In the early months tracking our original dataset (Sydney, Melbourne and Brisbane) we found some striking similarities in the impacts of the pandemic on mobility. During March 2020 travel to all destinations fell dramatically, with steady partial recoveries into the middle of 2020. Subsequently some localised differences as different lockdowns hit different cities at different times after the first wave of cases in March and April. For example, in Melbourne CBD movements were down around a quarter of pre-COVID levels for most of winter 2020, while Sydney and Brisbane were back to over half of normal levels.
What happened to mobility in Perth?
Curious to know how Perth’s COVID mobility experience compared to other major capitals, VLC’s analysts have recently re-constructed a picture of Perth’s travel patterns over the past 18 months. We analysed mobile phone app records of when a phone handset travelled to CBDs, airports, rail stations and shopping centres. The frequency of visits each day are compared relative to pre-COVID levels to understand how lockdowns and changing traveller preferences affect mobility.
Compared to the three largest cities, Perth experienced:
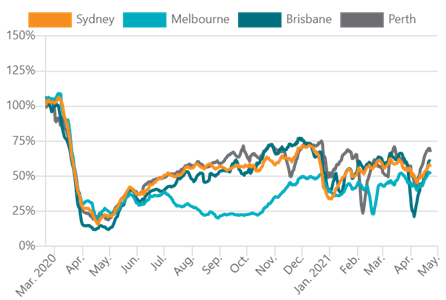
- A relatively strong return to CBDs over 2020, with over 70% of travel returning by October (though Brisbane and Sydney had caught up by the end of the year). Short lockdowns in early 2021 have contributed to CBD travel continuing to sit below 70% of ‘normal’.
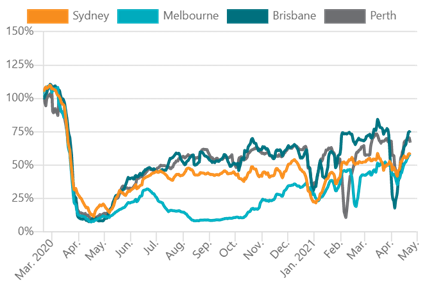
- Rail travel has rebounded to similar levels as Brisbane (60 to 75% of the pre-pandemic levels). Huge drops in patronage during the 2021 lockdowns do not seem to have had lasting effects on patronage.
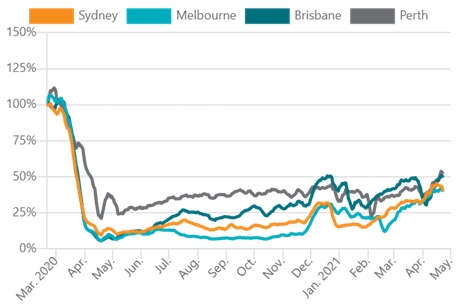
- Airport related travel was much more resilient in Perth than other cities – generally not falling below 25% and back to 40% by the end of 2020 – likely reflecting the role of fly-in-fly-out workers in the city. In recent months the recovery has pushed closer to 50% of the pre-pandemic levels.
I would like to acknowledge the significant contribution that my colleagues Ali Inayathusein, Benjamin Cowley and Dominic Endrei have made in release of the VLC COVID-19 mobility trends dashboard, and to Merryn Taylor and James Waldersee for analysing the Perth data.